There is no set formula to make your video go viral or to trick the YouTube algorithm. With 500 hours of content being uploaded on YouTube every minute, it’s difficult to get your video the attention it deserves. Creating a bustling YouTube channel starts with better understanding your viewers, that is where YouTube Analytics comes into the picture.
YouTube Analytics offer metrics and reports that evaluate the performance of your channel, as well as the resonance of videos to the channel’s audience. These analytics are powerful resources as they give you access to exactly the information that will help you optimize your video strategy. It is critical to analyze YouTube metrics to know how your channel is doing well and find opportunities for improvement. There is a lot of data available for Youtubers in different reporting options, a few of them are :
Overview report
The overview report provides a snapshot of the performance of your channel within the last 28 days. It presents your audience breakdown by demographic features: sex, age, and geographic location. This data is beneficial if you are looking to get a general idea of the behavior of your channel, however, it will only provide you with the most basic summary of channel performance.
Watch time report
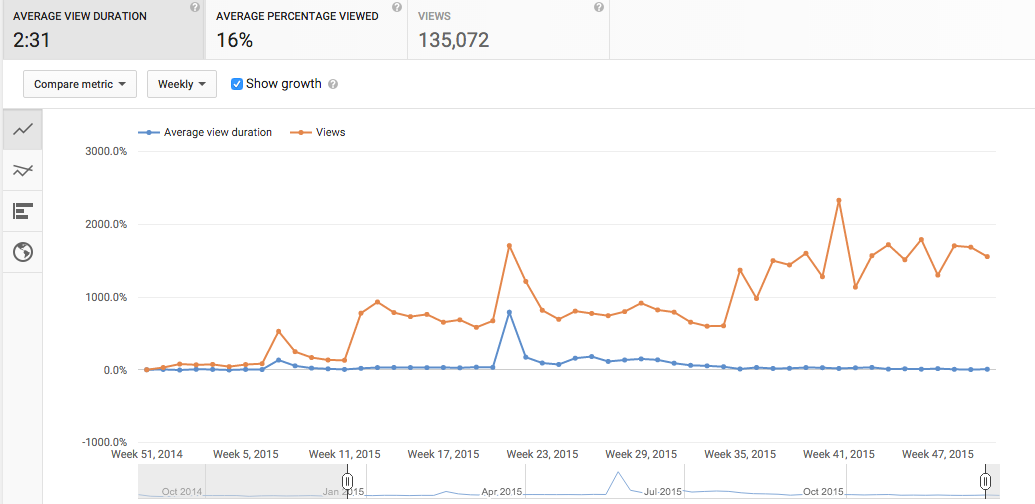
In the watchtime reports, you will find the most valuable data that YouTube offers. These reports break down how your different videos perform, dissecting into metrics like average view percentage, average view duration These metrics define the success on YouTube and is used in the platform algorithm to determine where your videos appear on YouTube search results and recommendations.
Engagement report
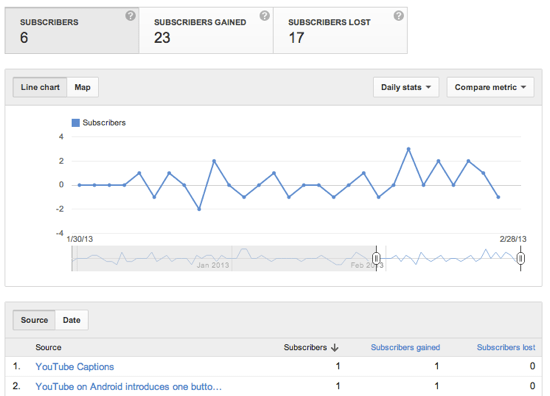
As you begin to understand watch time reports, you will also be interested in tracking what kind of engagement your videos are generating. YouTube Analytics delves into various engagement metric reporting include: Likes, Dislikes Comments, Subscriptions, Sharing These metrics provide more qualitative feedback and can help you understand the behavioral characteristics of your audience.
Audience retention report
The audience retention report shows how well your video holds the interest of your audience. From this report, you can see how much of each video your viewers watch and what parts are causing them to abandon your content. This will let you know what type of content works and does not work for your audience. Retention metrics are an indicator of how your video compares to other YouTube videos of similar duration and will help you determine the video duration that works best for you.
Traffic sources report
Traffic sources provide data on how your audience finds your video. It enables you to see what is accessible to your video search and will help you determine which referral platform, such as Google search or a YouTube playlist, is sending the most traffic to your video. With this data, you can amplify your video exposure via the best traffic source through paid advertising or social media boost.
If you are really looking to make the most of YouTube Analytics, you will have to dive deeper into different detailed reports like earnings, devices, location playback, etc. It’s essential you analyze the report that matches the best with your goals and KPI.
Interested in getting your YouTube channel seen by a huge audience the right way? Get started here: www.flintzy.com.


